At a Glance Series
This series will share quick insights from international trade data — not just numbers, but the narratives they reveal. In a time of tariff turmoil and rising risks in global commerce, understanding supply chains and potential disruptions is more important than ever.
United States Agriculture
U.S. agricultural trade ran at a median $145.7B per year, growing at a CAGR of 5.6% and adding $35.7B of value over the period. Growth was led by Cereals, contributing a 25% of the period's growth; After a surge in 2022, trade flows stabilized in 2024, following the pullback on food prices.
Make this yours. Click here to edit the text and include any relevant information.
_page-0002.jpg)
Greater China Semiconductor Devices
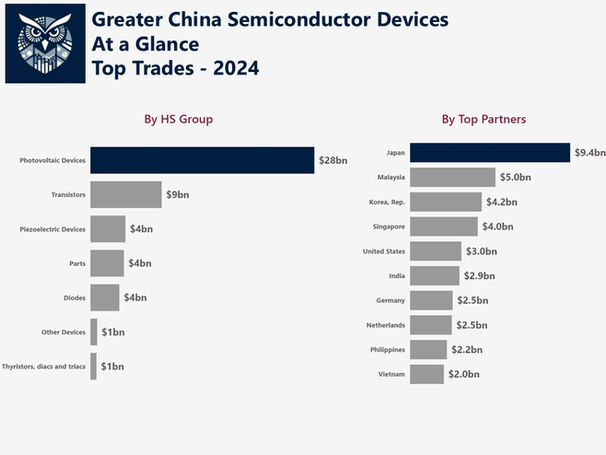
Greater China's semiconductor device (Non-IC) trade reached a median annual value of $51.9B, with a total growth of $15.2B over the 2016–2024 period. The market expanded at a CAGR of 3.64%, led by Photovoltaic Devices, though recent years show signs of deceleration
Make this yours. Click here to edit the text and include any relevant information.

European Union Natural Gas
Between 2019 and 2024, the EU’s trade in petroleum gases and hydrocarbon gases reached a median annual value of $142B, with a total growth of $28B over the period. Despite this expansion, the market experienced a modest CAGR of 5.1%, reflecting both price volatility and shifting supply dynamics.
Make this yours. Click here to edit the text and include any relevant information.

Greater China - Semiconductor Devices At a Glance...
Greater China's semiconductor device (Non-IC) trade reached a median annual value of $51.9B, with a total growth of $15.2B over the 2016–2024 period. The market expanded at a CAGR of 3.64%, led by Photovoltaic Devices, though recent years show signs of deceleration.
-
Trade led by Photovoltaic Devices ($29.4B/yr; CAGR 6.94%). The strongest corridor is China–Japan with a trade flow of $6.6B/yr; CAGR -6.86%.
-
Largest surplus with India ($3.87B; Trade Ratio 0.99), largest deficit with Malaysia ($3.51B; Trade Ratio -0.71).
-
Emerging growth in HTS 854121 (Transistors) with CAGR 4.87% and strong signals in Brazil and Thailand.
The semiconductor device trade in Greater China has shown steady expansion from 2016 to 2024, with a notable peak in 2021 followed by a pullback in 2023 and 2024. Regional integration is evident through diversified trade corridors, especially with Japan, India, and Southeast Asia. Photovoltaic Devices dominate the product landscape, followed by Transistors and Diodes, with trade flows concentrated in China’s exports to Japan and imports from Malaysia. Pricing trends remained relatively stable, but trade balances shifted, with India and Brazil emerging as surplus partners while deficits widened with Malaysia and Japan. Strategically, the region faces both opportunity in emerging markets like Brazil and risk from declining corridors such as China–Japan, suggesting a need for policy recalibration and diversification.
European Union Petroleum & Hydrocarbon Gases, At a Glance (2019–2024)
Between 2019 and 2024, the EU’s trade in petroleum gases and hydrocarbon gases reached a median annual value of $142B, with a total growth of $28B over the period. Despite this expansion, the market experienced a modest CAGR of 5.1%, reflecting both price volatility and shifting supply dynamics.
-
Trade Leaders: Dominated by Natural Gas ($86.9B/yr; CAGR 0.01%). Strongest corridor: Germany–Special Categories ($32.3B/yr; CAGR -9.75%).
-
Trade Balance Extremes: Largest surplus with Ukraine ($328.5M; Ratio 0.46), largest deficit with Russian Federation ($18.98B; Ratio -1).
-
Top Emerging Market: Rapid growth in LNG (HS 271111) with CAGR 19.5%, especially from the United States
The EU’s hydrocarbon gas trade has grown steadily, though unevenly, over the 2019–2024 period. The market saw a sharp rebound post-2020, peaking in 2022 before contracting again in 2023–2024. Regionally, Germany, Italy, Belgium, and France remain central importers, with the United States, Algeria, and Norway emerging as key partners. Trade flows are heavily concentrated in LNG and LPG, with LNG showing the strongest growth, particularly from the U.S. and Qatar. Pricing trends show a Price CAGR of 14.7%, while Volume CAGR declined by -8.3%, indicating rising unit costs and potential supply constraints. Strategically, the EU’s reliance on a narrow set of suppliers —especially during geopolitical tensions— poses risks, but also opens opportunities for diversification and investment in LNG infrastructure.


